
Assign specific report codes to key accounts
Return on Advertising Investment
The E-commerce template combines some of the key metrics E-commerce businesses should focus on. These metrics are split across the Sales Metric, Sales Analysis Metric and Customer Metrics pages in Spotlight. To make the most of the retail template, you will need to:
Most retail metrics require financial and non-financial data. Therefore, you will need to collate and enter the following non-financial information into Spotlight:
You can manually enter the data into the non-financial tab under Customise Data. Alternatively, enter the data into this Excel template and import it into Spotlight using the Excel import function on the Import tab.
Most report codes needed for the template are automatically assigned by Spotlight. However, for the metrics to calculate correctly you may need to assign some report codes manually. To do this, open Customise Data and locate the following accounts, then to assign the specified report code click the report code button:

Formula: Total Customers / Sales - Visited
Report codes: CUS.TOT, SAL.VIS

Formula: Sales - transactions
Report codes: SAL.TRA

Formula: Trading Revenue/Sales - Transactions
Report codes: REV.TRA, SAL.TRA

Formula: Trading Revenue/Total Customer
Report codes: REV.TRA, CUS.TOT

Formula: 1- (Sales transactions/Sales lead) * 100
Report codes: SAL.TRA, SAL.LEA

Formula: Trading Revenue/Sales & Marketing Expenses
Report codes: REV.TRA, EXP.SAL

Formula: (Sales Returns/Sales Transactions) * 100
Report codes: SAL.RET, SAL.TRA

Formula: (Direct Wages Cost of Sales + Sales & Marketing Expenses + Wages and Salaries Expenses)/New Customer
Report codes: EXP.COS.WAG.SAL, EXP.SAL, EXP.WAG.SAL, CUS.NEW

Formula: New Customers + (Total Customers - New Customers)
Report codes: CUS.NEW, CUS.TOT

Formula: (NPS - promoters/ NPS - detractors) / NPS - passive
Report codes: NPS.PRO, NPS.DET, NPS.PAS
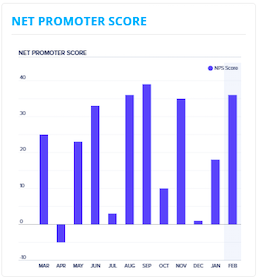
Formula: Net promoter score
Report codes: NPS.SCO

Formula: Customer Satisfaction
Report codes: OPR.CSR