You can use categories to filter consolidated reports and compare entities with certain traits. For example, if you run a group report consisting of entities located around the world, you might then want to run a comparative P&L for USA branches only. By creating categories, you can apply a label (for example to indicate the country) against each entity. Once you’ve applied these labels, you can filter a whole report, page or chart based on those labels.
Create a category
Note: You can add a maximum of two category levels.
From the main Spotlight screen, click the Settings option under the relevant group name.
Open the Categories / FX tab, then click Edit Categories.
Click Add Category and enter a category name, for example, Country.
Enter the name of the first option, then click Add Option. Repeat this step for each of the required options.
If required, to add another category click Add Category and repeat steps 3 and 4.
Assign a label to an entity
From the main Spotlight screen, click the Settings option under the relevant group name.
Open the Categories / FX tab, then from the required drop-down list, choose the option you need for each entity.
Remove a label from an entity
From the main Spotlight screen, click the Settings option under the relevant group name.
Open the Categories / FX tab, then click the label you want to remove and select No <Option>, for example, No Country.
Editing a category
Rename a category or label
From the main Spotlight screen, click the Settings option under the relevant group name.
Open the Categories / FX tab, then click Edit Categories.
To rename a category or label, type over the existing name then click Save.
Delete a category
From the main Spotlight screen, click the Settings option under the relevant group name.
Open the Categories / FX tab, then click Edit Categories.
To remove the category, click the ‘X’ on the right-hand side of the category.
Delete a label
From the main Spotlight screen, click the Settings option under the relevant group name.
Open the Categories / FX tab, then click Edit Categories.
To remove a label, click Remove.
Filtering
Filter the full report
Once you’ve set up your categories and assigned labels to your entities, you can filter a report to only show data for the entities in a specific group. For example, you may want to compare data for all entities based in the UK.
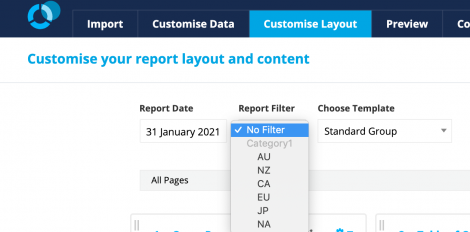
To do this, open the report and from the Customise Layout tab open the Filter drop-down list. You can then choose a label, and the report will filter to only show data for any entities assigned to that label.
Note: You can only filter by one label at a time.
Filter a single page
Rather than filtering a whole report, you may want to filter a single page within a report. For example, to have a page comparing data for all entities set as Retail.
From the Customise Layout tab, locate the page thumbnail for the page you want to filter.
Click the 'hamburger' icon at the top right-hand corner of the thumbnail.
Select the required filter options, then click Apply.
The page will now only show data from entities with that label.
If required, you can add other pages and filter them to show the other labels.
Filter a single chart
Rather than filtering a whole report, or a whole page by a label, you can filter a single chart. For example, you may want to have a chart comparing sales data for entities based in the UK.
From the Customise Layout tab, hover over the page then click Customise.
Hover over the chart, click Edit, then open the Filter tab.
You can now select a category and choose which labels you’d like to filter your chart into.
You can have up to six charts on a single page. So for example, you could include a chart comparing data for each country, for example, one for UK entities, another for NZ entities and another for Australian entities.
Note: Unlike reports and pages, you can filter a chart with multiple labels. For example, you could show data for entities under labels NZ and Australia but not the UK. When you do this, the data for each label appears as a separate series on the chart.